The Tableau Dashboard is the collection of worksheets and views which are put together in a single place to provide the comparison of a variety of data simultaneously. Dashboards are really useful in those cases where we have to explore multiple views daily, in that case, we can create a Dashboard combining all those views despite navigating separate worksheets. During the creation of the Tableau Dashboard, we can add the views from any worksheet so when the corresponding worksheet is updated the views are refreshed with current data, and when the views are updated from Dashboard the corresponding worksheets are updated. We can access the Tableau Dashboard from the tab mentioned at the bottom of the worksheet.
Create a Tableau DashBoard
To Create the Tableau Dashboard we would be using the "Sample-superstore" data sets. First, we will create two sheets with the name Sales_Profile_Data and Sales_State_Data and after that, we will create the Dashboard and use these two sheets in the Dashboard.
Let's follow the below steps to complete these tasks.
Step 1:-
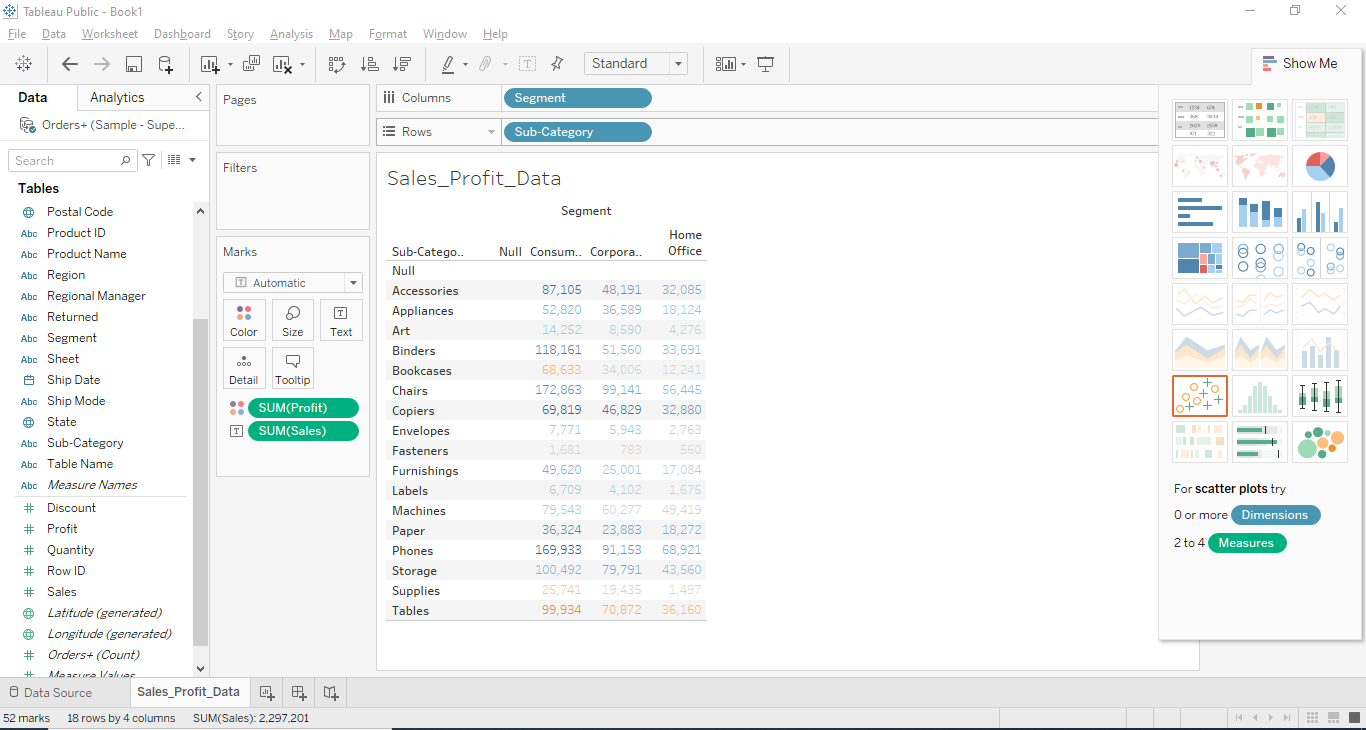
Once the "Sample-superstore" data sets are loaded, go to sheet 1 and drag dimension SEGMENT to columns and SUB-CATEGORY dimension to the rows. Now Drag the PROFIT into colors and SALES into the text as mentioned in the below figure. Once this is done the following chart will be prepared. Now Rename sheet 1 by right-clicking on that and name it Sales_Profile_Data.

Step 2:-
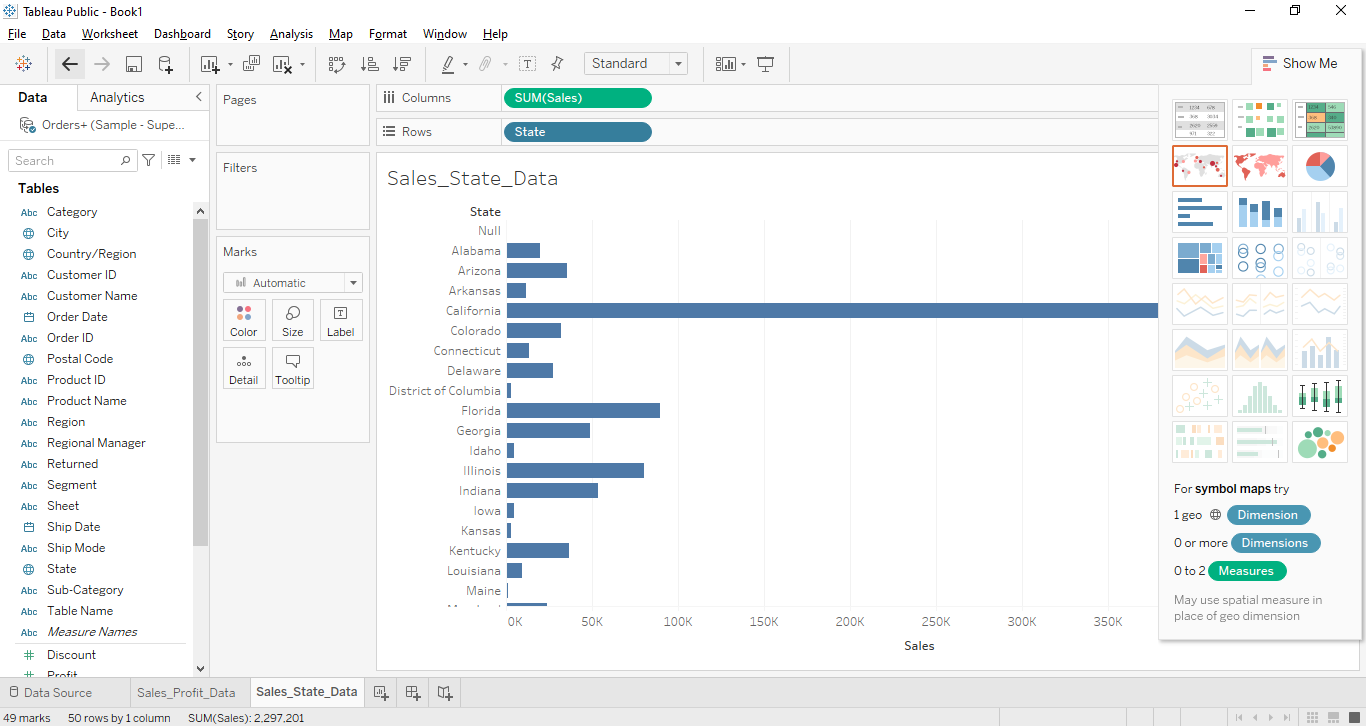
Now create another sheet by Worksheet Menu -> New Worksheet or you can create from the bottom tab. Drag the dimension STATE to the rows and the SALES to the columns as mentioned in the below figure and change the sheet name by right-clicking on that and naming it to Sales_State_Data.

Step 3:-
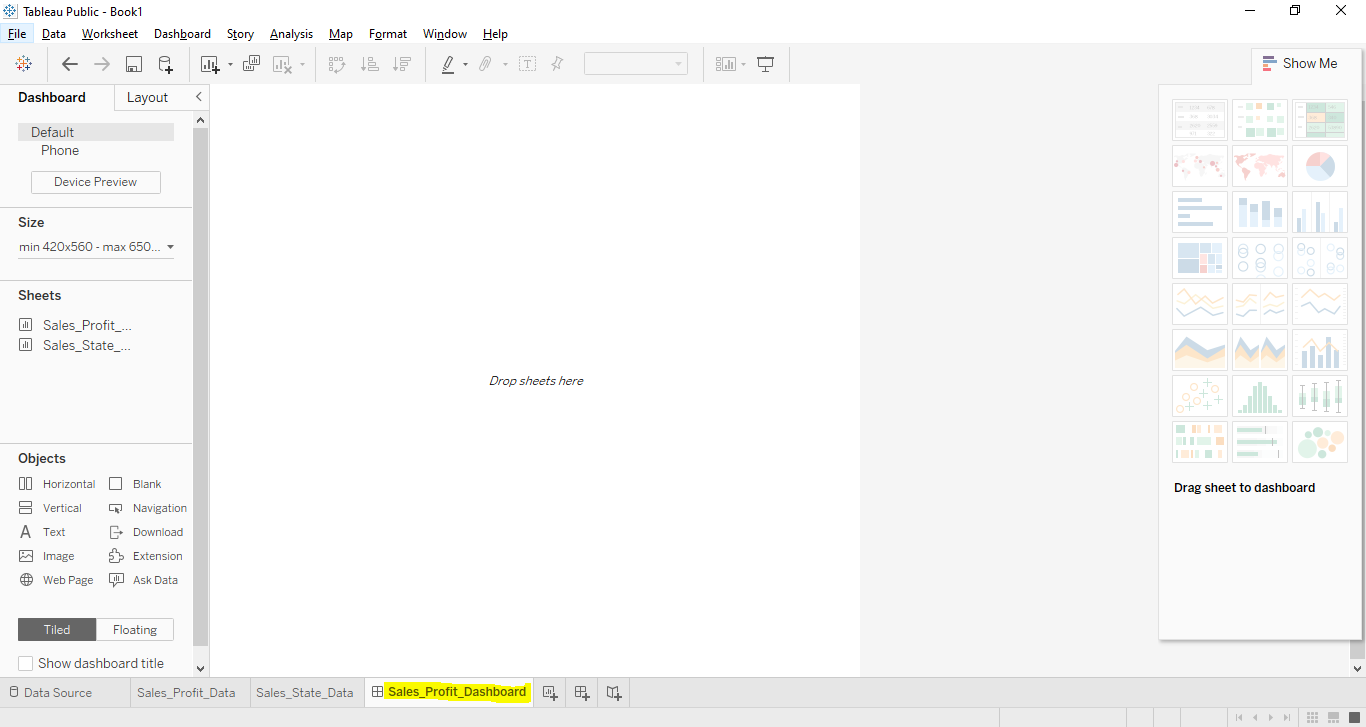
Create the Tableau Dashboard from Menu Dashboard -> New Dashboard or the tab mentioned at the bottom of the sheet. Give the Dashboard name to "Sales_Profit_Dashboard".

Step 4:-
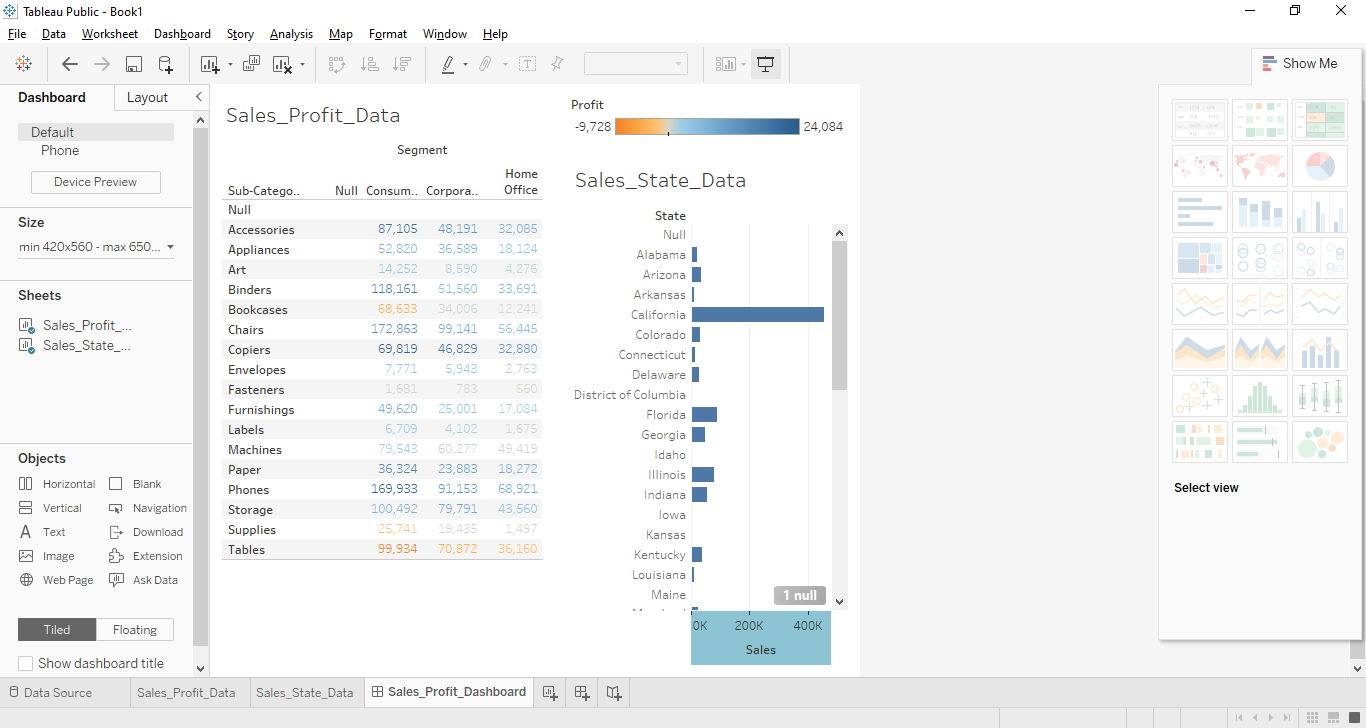
Now Drag both sheets "Sales_Profile_Data" and "Sales_State_Data" into the Dashboard as mentioned in the below figure and the Dashboard will be created.

We can launch the Tableau Dashboard by clicking on the below yellow highlighted presentation mode option.

